Summer of science: Monitoring Greenland’s melting ice sheet
A team of researchers headed to an unlikely destination this summer: the Greenland Ice Sheet. From May-August, the scientists studied ice melt in one of the harshest environments on the planet.
We spoke to Andrew Martin, a doctoral researcher from the National Centre for Atmospheric Science (NCAS) and the University of Leeds, about the ICECAPS-MELT project, and found out what a day in the life of a research scientist on an ice sheet is like.
What is the Greenland Ice Sheet and why is it melting?
An ice sheet is a large area covered by long-lasting ice. The Greenland Ice Sheet is the second largest ice sheet on Earth – the largest being the Antarctic Ice Sheet. The Greenland Ice Sheet is almost 7 times larger than the UK and is over 3 km deep at its thickest point.
“Greenland is BIG, bigger than it often seems on a map! Fun fact, if you align the northernmost tip of Greenland with the top of Scotland, the southernmost tip of Greenland would touch the north African coastline!”
Andrew Martin, doctoral researcher from the National Centre for Atmospheric Science and the University of Leeds
During the summer months, it is usual for the Greenland Ice Sheet to have some melt. The constant sunlight and warmer temperatures mean that the surface of the ice sheet can get above 0 degrees celsius – the temperature at which ice melts.
Until recent years, the melt that the Greenland Ice Sheet experiences in the summer months has been roughly balanced by the amount of new snow falling onto the ice sheet. However, as human activity continues to release more greenhouse gases and drive global warming, the amount of melt is no longer balanced by new snowfall. Between 2010-2018, the ice sheet melt rate was 6 times higher than between 1980-1990.
The impacts of the melting ice sheet are far reaching and serious. The melting ice sheet contributes to sea level rise, threatening coastlines and making severe flooding more likely.
Alongside increased global temperatures, there are other factors impacting increased ice sheet melt. The ICECAPS-MELT project is making observations that are being used to identify and better understand the reasons why the Greenland Ice Sheet is melting.
What is the ICECAPS-MELT research project?
The ICECAPS* science group began in 2010 and is jointly funded by the American National Science Foundation and the UK’s Natural Environment Research Council. Researchers from the US and UK collaborate on the experiments and observations required to answer science questions about the Greenland Ice Sheet.
“The ICECAPS project has been taking measurements of the atmosphere over the ice sheet since 2010 at a site called Summit Station, located right at the top of the ice sheet. These have involved cloud-profiling lidars and radars, daily weather balloon launches, radiation measurements, meteorological measurements, and many other observations – even right through the grips of polar winter ,” explains Andrew.
“Scientists at the National Centre for Atmospheric Science have contributed to the ICECAPS-MELT research project by developing critical software and by heading to Greenland to help with the deployment and demobilisation of the platform,” Andrew adds.
Andrew and his NCAS colleague Dr Heather Guy – who studied clouds over Greenland’s melting ice sheet with a Helikite last year – recently returned from Raven Camp. The camp is where the ICECAPS-MELT project is based in the Greenland Ice Sheet percolation zone – where the ice sheet experiences a significant amount of melt each year.
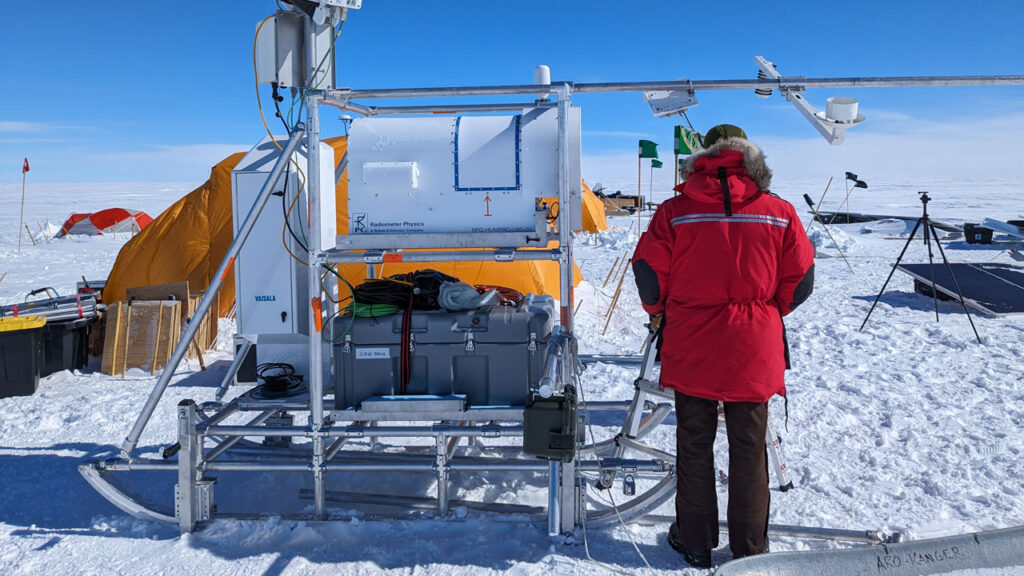
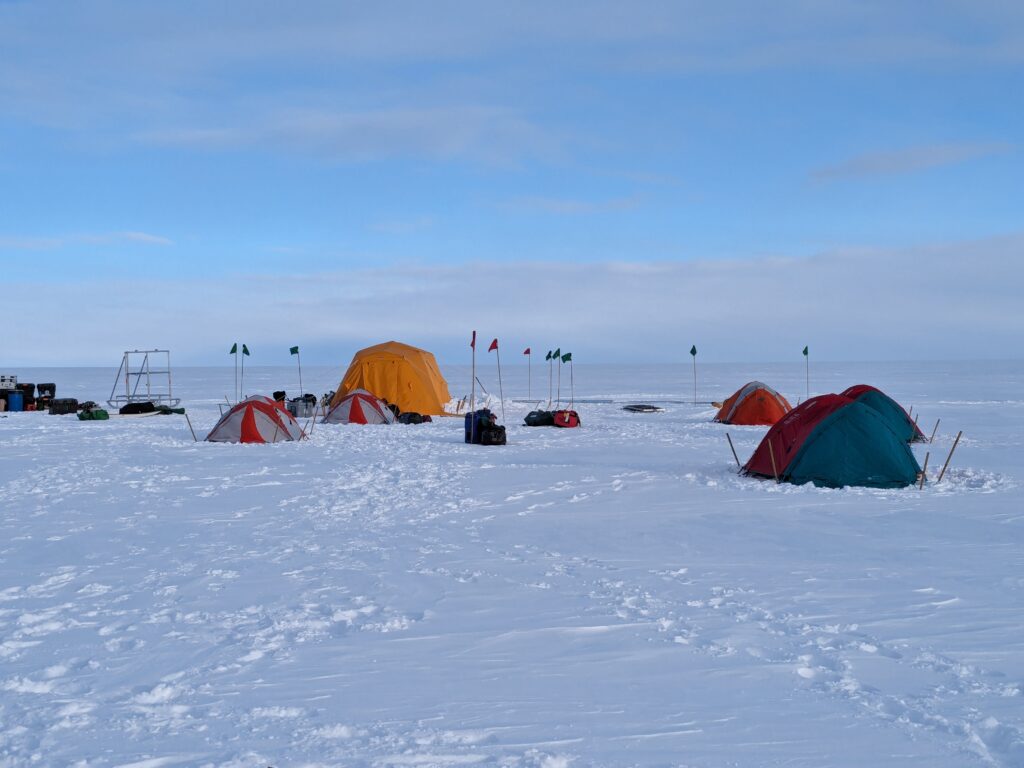
It took one week for Andrew and his colleagues to finish setting up their campsite and renewable power system at Raven Camp. The MELT platform was powered exclusively on solar and wind renewable energy, and the solar panels and turbines had to be set up by the team as soon as possible after they had arrived.
“Raven was selected as a site, partially due to its accessibility, and partially its location relative to Summit – we know that many of the atmospheric events that produce the most melt travel from the south-west of Greenland, up and over the central ice sheet. Measurements at Raven will capture the most impactful atmospheric events as they’re still travelling up the ice sheet, and then they’ll be measured again at Summit,” explains Andrew.
“The ICECAPS-MELT project has many aims for its research, which helps explain why we have over 50 different instruments and sensors on the platform,” says Andrew.
“MELT stands for MEasurements along Lagragian Transects – essentially, we want to observe the evolution of air masses as they travel over the Greenland Ice Sheet, and evaluate the impact of them on the surface. The ICECAPS project already has an observation station at Summit, located at the top of the Greenland Ice Sheet, so to observe air mass evolution, we need to measure air masses at at least one other point on the ice sheet – and that’s at Raven!
“The project has also been a test of technology and the team – proving that we are able to deploy (and demobilise, thanks to Heather Guy) a comprehensive measurement platform in one of the harshest environments on the planet, and have it run entirely on renewable power,” adds Andrew.
The platform has been sending summaries of the recorded data each day, allowing researchers like NCAS’s Andrew and Heather to view processes impacting ice sheet melt in near-real-time.
How is ice sheet melt measured?
“Melt over the entire Greenland Ice Sheet is pretty difficult to measure. For melt mapping over large areas we use satellite observations to make our best estimates of where melt is occurring. However, the resolution on these measurements is generally coarse in time and space,” explains Andrew.
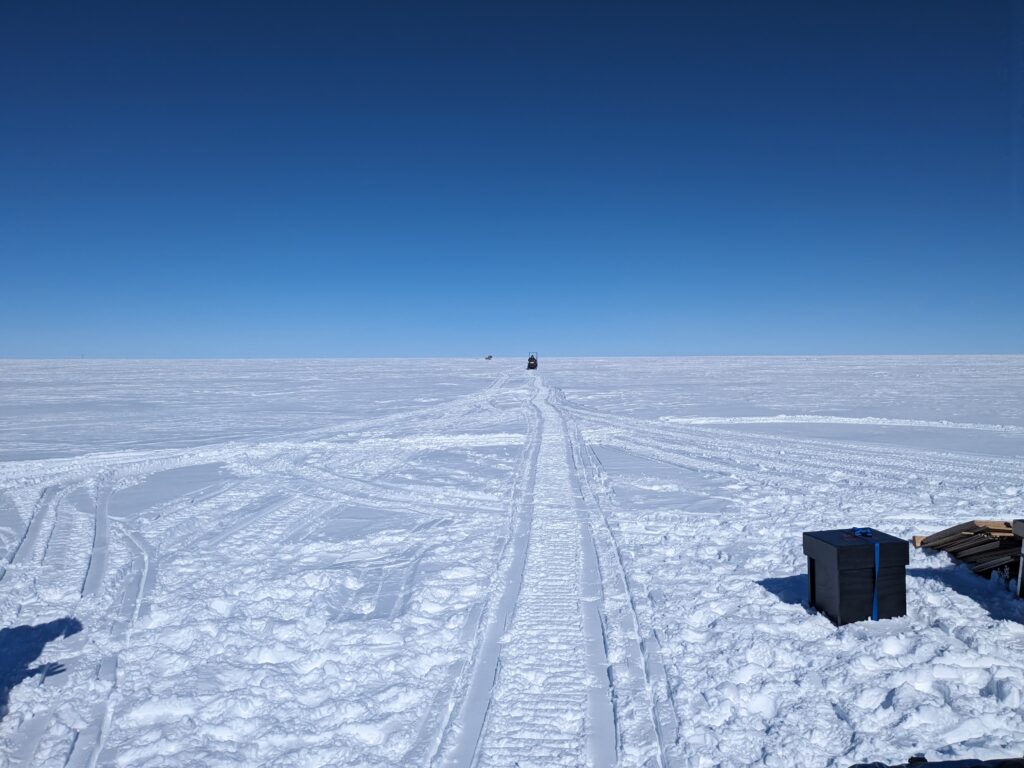
“On-site measurements can have a very high time-resolution and be incredibly accurate as they can sample the atmosphere and ice sheet directly. However, there are a few issues with making observations in the middle of an ice sheet. It’s very cold. It’s very remote. It’s hard to live out there. Autonomous platforms avoid that last issue, but they need to be very robust – if they break and require another expedition to be fixed.”
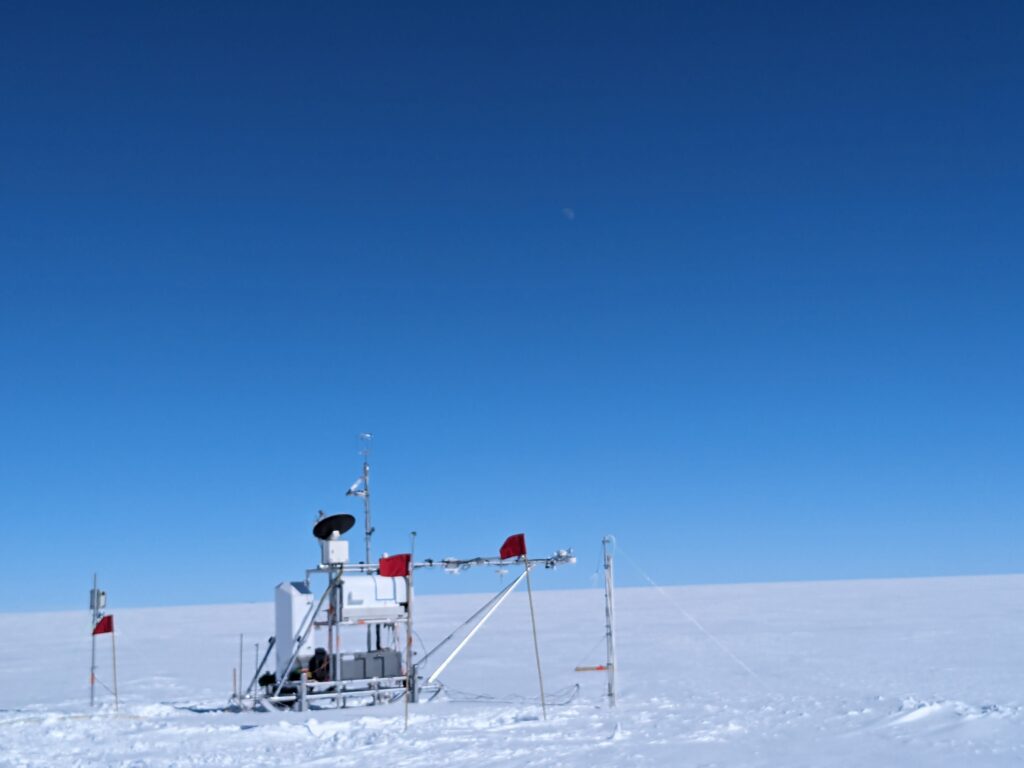
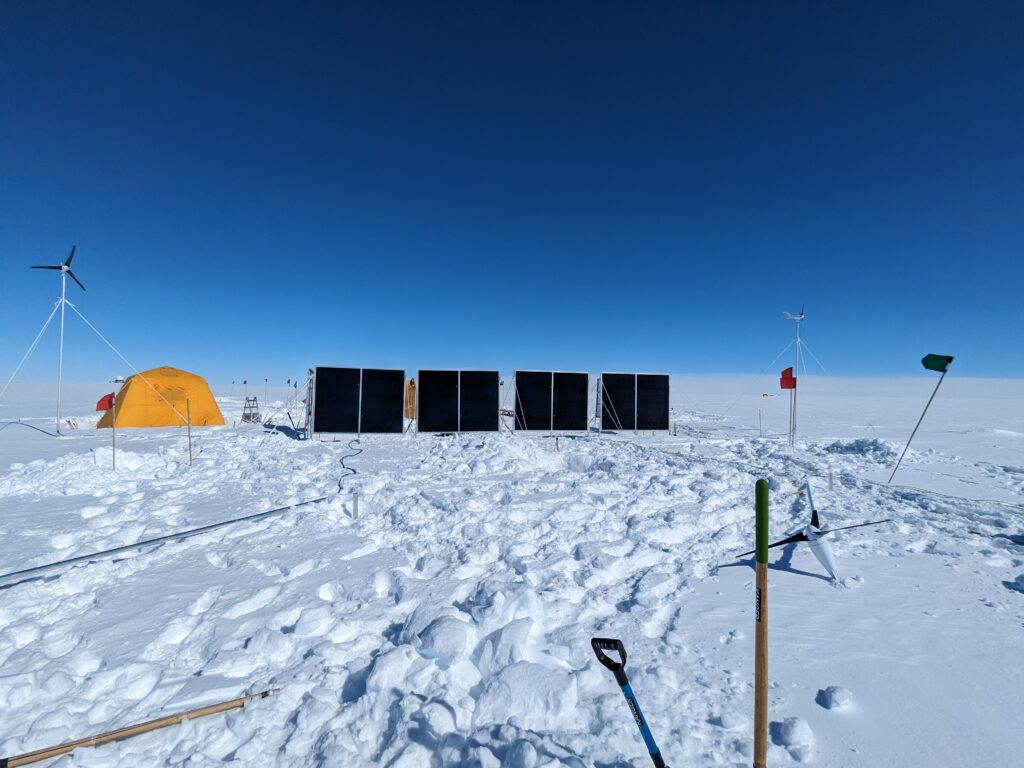
The SLEIGH platform, deployed at Raven Camp, contained many different instruments taking a range of measurements, from sunlight and thermal emissions, air and subsurface temperatures, and humidity.
“We also have a ground penetrating radar that observes layering on the subsurface snow. Each year, new snow is deposited on the old, and melting water often percolates to a specific depth, which is different every year, before refreezing. This forms a hard ice layer in the firn which is picked up in the ground penetrating radar. We are hoping, as melt occurs through the summer, to observe new layers appearing in response to surface melt. We hope to also to identify this by observing temperature increases in the sub-surface temperatures at specific depths,” Andrew adds.
What is an average day on the ice sheet like?
Working on the Greenland Ice Sheet comes with a very unique daily routine. We asked Andrew to describe what a day in the life of a research scientist is like.
“Typically, a day would start off waking up, nice and cosy inside a sleeping bag, inside another bigger sleeping bag. Getting out of those was always the hardest part of the day – not only is it a really awkward shuffle to avoid brushing up against the frozen walls of the tent (spreading frost everywhere in the process), it’s also crawling out into the subzero air of the tent.
“First task of the day, refill the snow melter and get the kettle going. Then coffee and breakfast (porridge with freeze dried fruit, powdered nut butters and occasionally solar-power-freshly-baked cinnamon rolls!), followed by the morning meeting.
“We’d all sit in our chairs, and discuss how we’d slept. Any aches and pains, and how we’d mitigate them. Safety and comfort were the top priorities. Then a quick discussion about the hazards of the day to come – which dug pits we needed to avoid the most, harsh weather, heavy lifting.
“And finally, what we were actually going to do during the day. This varied day to day, but some highlights include: getting the instruments mounted onto the SLEIGH platform, digging holes (so many holes) for standing the solar panels in, assembly and erecting of the wind turbines (a whole team effort), or finally pushing the SLEIGH to its resting place out beyond the confines of our camp.
“Then, the best bit of the morning – the daily stretching and silent-dance-party in the tent. We’d each name a stretch, everyone would join in, and slowly we’d warm ourselves up for the day, and work the stiffness of the previous day out of our joints. There were always smiles on faces and eagerness to go by the end.
“Then off to work! We’d typically work through the morning, taking breaks when we needed to go inside the tent, grab a snack and a hot drink as needed. Usually one person would be on cooking duty for the day – they’d break off early to make lunch in the electric air-fryer/pressure cooker (we were really living it up on the ice sheet), so everyone could come into the tent with a nice warm meal waiting for them.
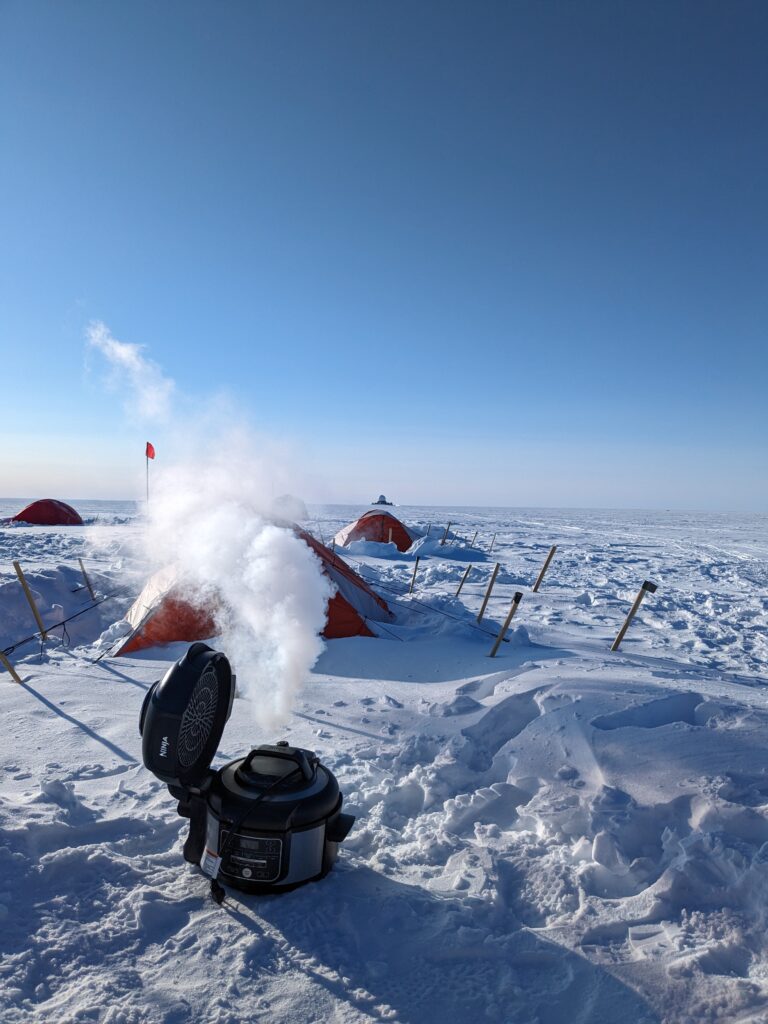
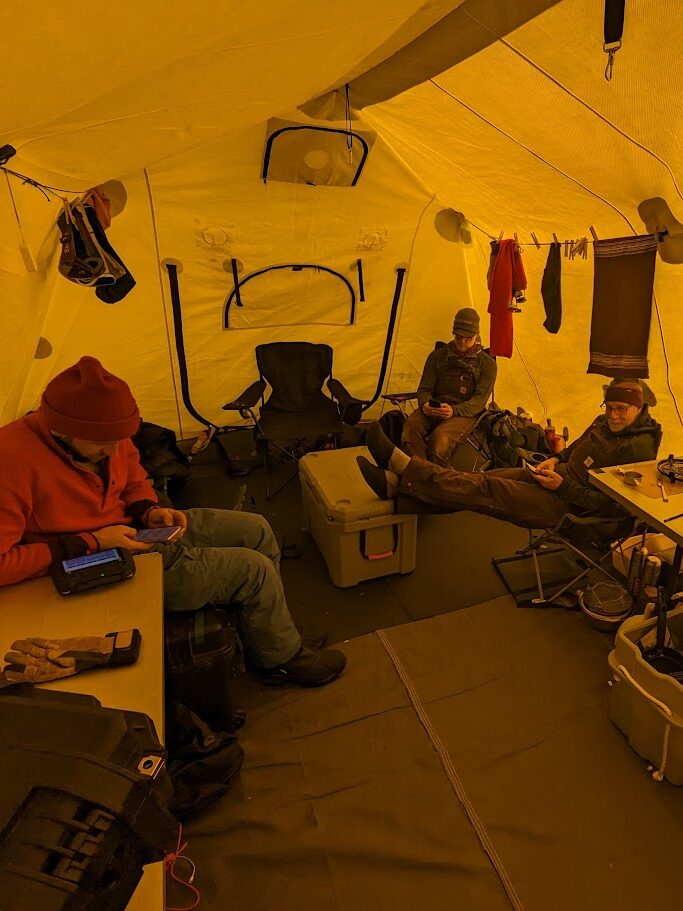
“Then working again in the afternoon, until the call went out that dinner was ready at around 6:30. That would be the end of the day – dinner, a quick discussion of what we’d achieved, and what we’d do differently on another deployment like this, and then card games, reading, or simply chatting. One by one we’d all drift off back to our tents to sleep. Before that though, we’d boil the kettle again, and take two hot water bottles each with us, to help stave off the -30°C or lower temperatures at night. And then we’d get up the next day and do it all again!”
Watch timelapse footage of the science instrumentation
*ICECAPS is an international team of researchers from the Cooperative Institute for Research in Environmental Sciences at University of Colorado, Washington State University, University of Leeds, University of Wisconsin, the US’ National Oceanic and Atmospheric Administration, the UK’s National Centre for Atmospheric Science, Dartmouth University, Earth and Space Research, Boise State, and the Wisconsin Space Science and Engineering Center. Find out more about the ICECAPS-MELT project by visiting their blog.
Photos taken by Andrew Martin. Timelapse footage taken by Michael Gallagher.
