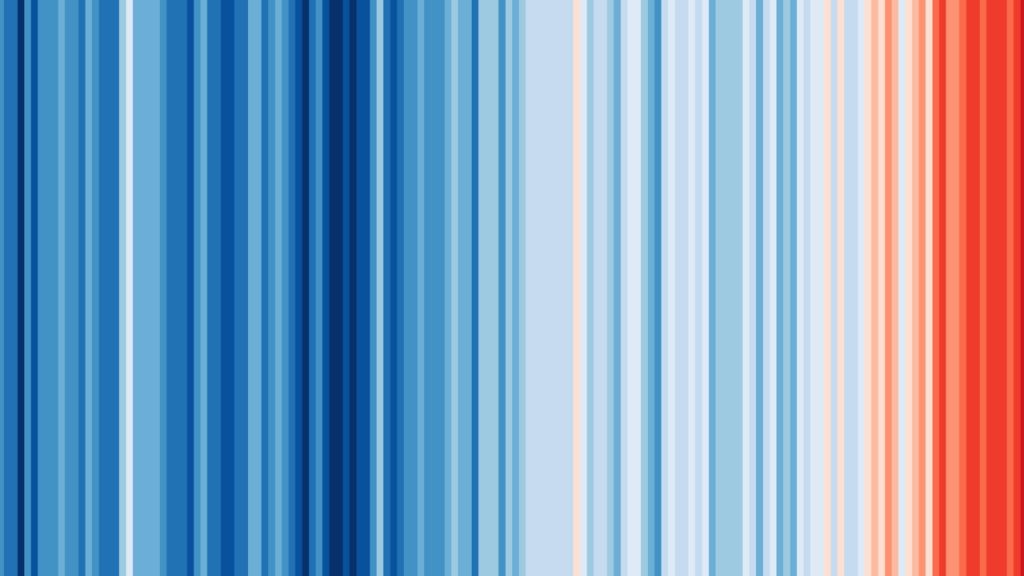
Warming up for #ShowYourStripes 2023 to support global climate change action
Today is World Environment Day, which marks just over two weeks to go until people around the world will unite to support climate change action through #ShowYourStripes on Wednesday 21 June 2023.
#ShowYourStripes is a global climate change movement that encourages people to share a simple but striking climate change visualisation – known as the Warming Stripes – as a way to capture attention and spark conversations on climate change.
The Warming Stripes infographic, created by Professor Ed Hawkins at the National Centre for Atmospheric Science and University of Reading, is a visual timeline of our changing climate.
Hundreds of versions showing warming in countries and states worldwide are free to download, allowing people to see and share how climate change is affecting the places they care about.
Professor Ed Hawkins, a climate researcher who created the colourful graphic says:
“The warming stripes show the stark reality of how quickly the planet has heated over the past few decades, combining billions of scientific measurements into one striking image. The stripes do not show our future, which is still entirely in our hands – the faster we act the smaller the climate consequences will be.”
To create the design, Professor Hawkins’ replaced numerical data with intuitive colours to help people to understand how the planet has warmed over the last one hundred and fifty years.
The climate stripes use bands of colour to show how temperatures in all corners of the world have risen dramatically in recent years. Shades of red are used to denote years that were hotter than the average for the period, and blues to indicate cooler years.
The climate timelines start from the earliest available records, typically during the nineteenth century, and continue to the present day. They reveal a dramatic rise in temperatures in recent decades.
The aim of the climate stripes is to start conversations and bring climate science to more people. I am constantly amazed by the inventive ways that people use to adopt the stripes, and hope they help bring climate action to the front of people’s minds once again this year.
– Professor Ed Hawkins explains why he created the blue and red climate graphic.
The climate stripes were created in 2018 and were made available for the public to download for free in summer 2019. More than a million people did so in the first week after they went live.
“I wanted the long-term trends and variations in temperature to be crystal clear for viewers. Our visual system will interpret the stripes without us even thinking about it.” – Professor Ed Hawkins
Accompanied by the hashtag #ShowYourStripes, the stripes have been shared by Greta Thunberg, the UN and the Intergovernmental Panel on Climate Change, and on global television channels.
They have been adopted in countless ways, including on badges worn by US senators, displayed on the Main Stage at Reading Festival, on football club strips, painted on public transport, and have inspired artists and artworks worldwide.
How will you #ShowYourStripes on Wednesday 21 June 2023?
Join the conversation on climate change by using the hashtag #ShowYourStripes. Follow @AtmosScience, @Ed_Hawkins, and @UniofReading on Twitter.
