National Centre for Atmospheric Science shares diversity data
We recognise that our organisation benefits from the different perspectives of our staff. To help us nurture a more inclusive science community, we have asked people working across the National Centre for Atmospheric Science to tell us about themselves.
This year, around 100 staff took part in a survey that tracks different types of diversity. We are thankful for their contribution to our equality and inclusion work.
We hope that by collecting and sharing our diversity information, we can make fair and transparent plans to improve from where we are now.
Our diversity data in 2022
In this section you will find diversity monitoring information about National Centre for Atmospheric (NCAS) people, broken down by: gender, race, disability, sexual orientation, mental health, religion or belief, and caring responsibilities.
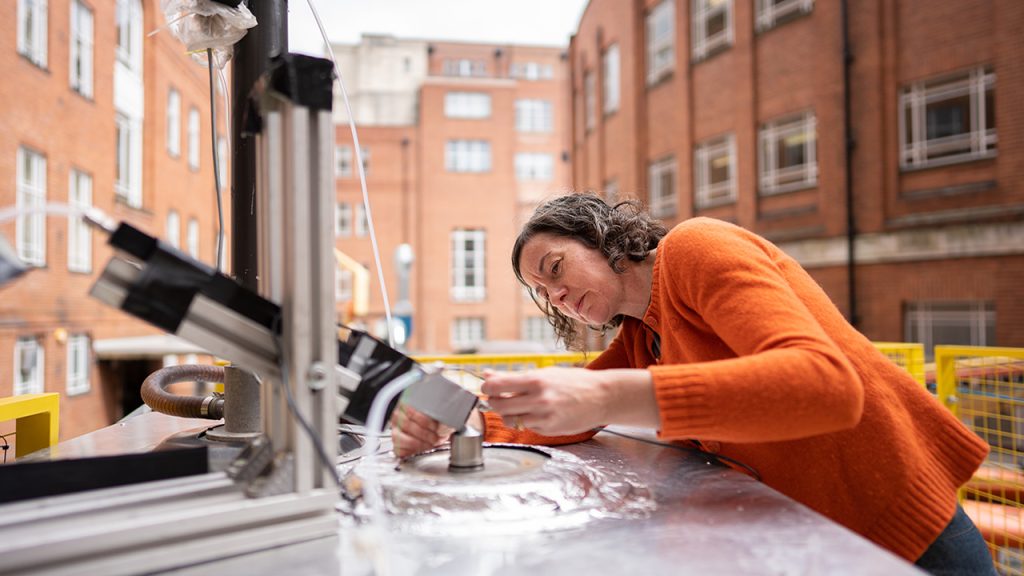
Gender
When asked “What gender do you identify as?”, 57% of staff said man, 42% said woman, and 1% preferred not to say.
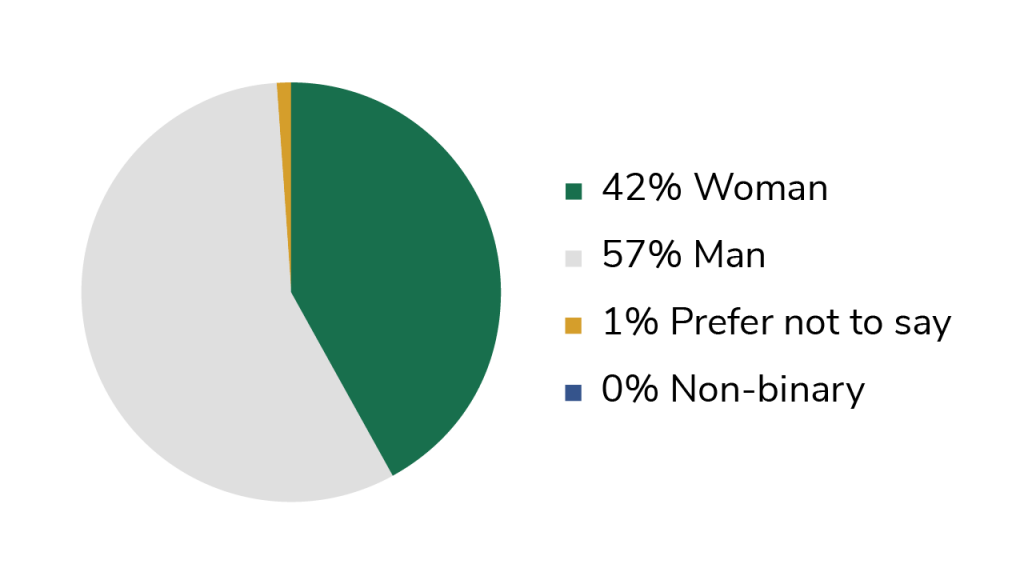
Age
When asked about their age, we found out that 1% of staff are 25 years old and under, 22% are 26-35 years old, 31% are 36-45 years olds, 28% are 46-55 years old, and 16% are 56 years old and over.
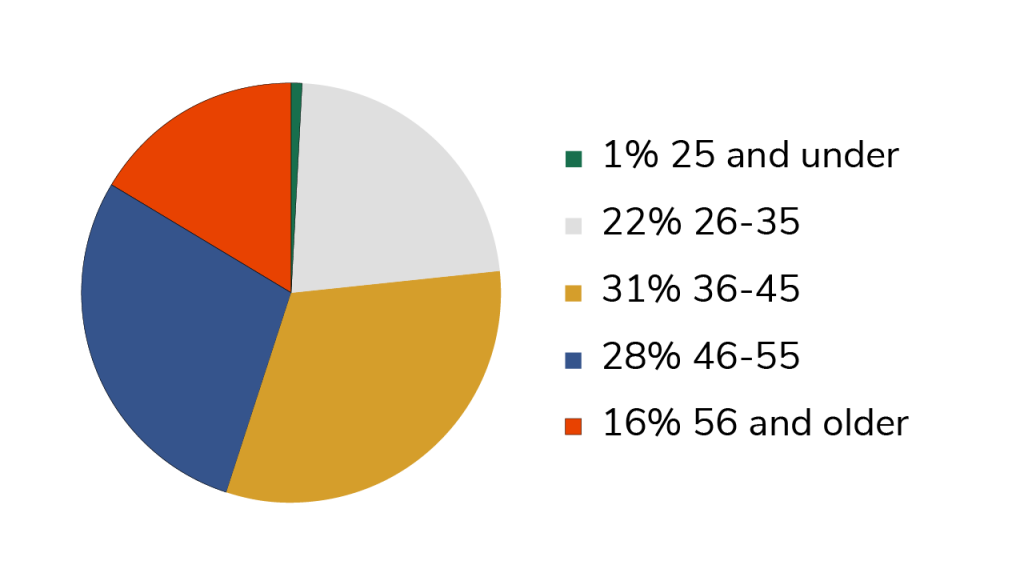
Ethnicity
The Office for National Statistics reports that 86 % of the UK working age population is white. We asked our staff: “Do you consider yourself to be from a minority, cultural, or ethnic group?” and 89% said no, 10% said yes, and 1% preferred not to say.

Country of birth
We asked staff if they were born in the country where they now live and work. 75% said yes, 22% said no, and 1% preferred not to say.
Disability
14% of people completing our survey said they consider themselves to have a disability. 81.7% said they didn’t, and 4.3% preferred not to say. According to the Office for National Statistics, 20% of the working age population reported living with a disability in 2020.
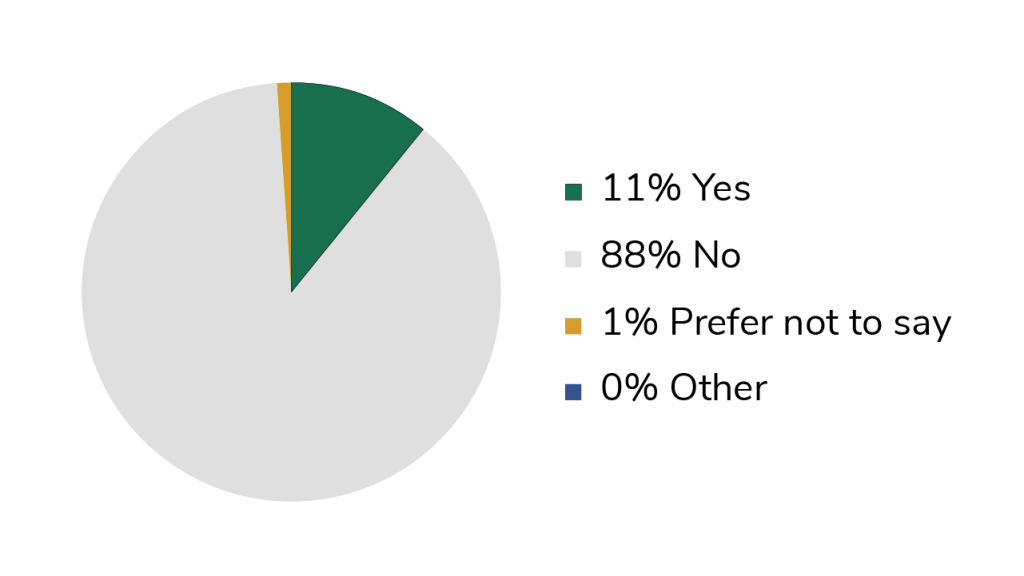
Sexual orientation
In 2020, the Office for National Statistics found that 3.1% of the UK population aged 16 years and over identified as lesbian, gay or bisexual. We asked our staff if they identify as gay, lesbian, bisexual, pansexual or asexual. 10.9% said yes, 88% said no, and 1.1% preferred not to say.
Mental health
We wanted to know if our staff consider themselves to currently have, or if they had ever experienced, mental health issues: 28.9% said yes, 67% said no, and 4.1% said they preferred not to say.
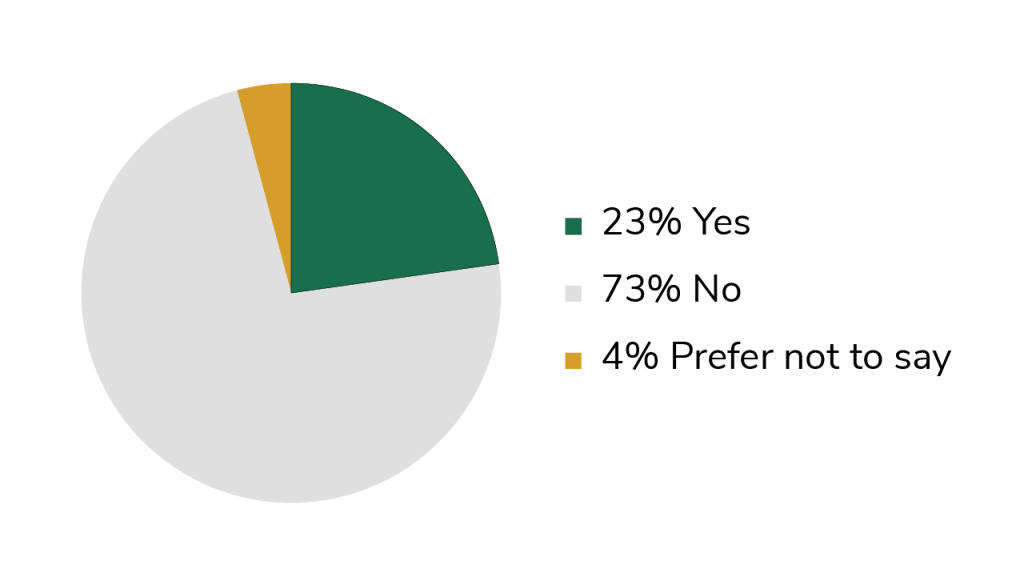
Religion
When we asked our staff: “Do you have a religion / belief that is important to you?” 23% of the survey respondents said yes, 73% said no, and 4% preferred not to say.
Socioeconomic status
Socioeconomic status is a measure of an individual or family’s income and social position in relation to others based on income, education and occupation. We asked staff if at the age of 14 if they considered themselves to be in a low socioeconomic position. 20% said yes, 67% answered no, 11% preferred not to say, and 2% said they didn’t know.
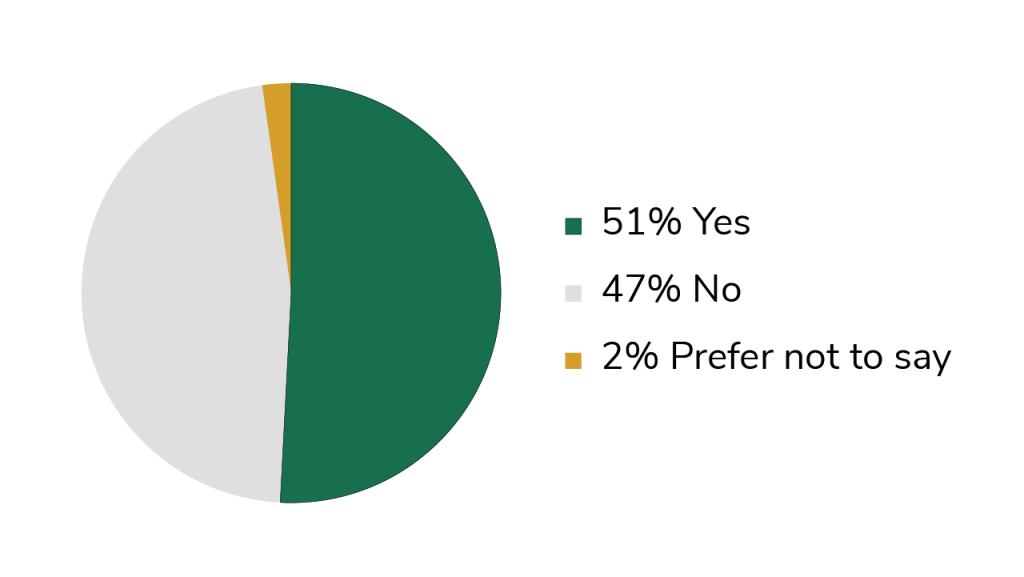
Caring responsibilities
We also wanted to find out if our staff had any caring responsibilities. 47.5% said no, and 1% preferred not to say. 51.5% replied yes, of which a third had responsibilities for people aged 18 and over.
Working hours
We asked staff to describe their usual working hours and working patterns. 78% of staff said they work full time, and 22% said they work part time. 36% said their working patterns were variable, and 64% said their working pattern was the same every week.
Making plans to improve
What does our diversity information tell us this year?
- Our diversity data could be more comprehensive to help further identify issues and barriers to inclusion.
- We need to reassure staff that they can share information and issues relating to their protected characteristics.
- We need to understand people’s differences, and seek to minimise or remove barriers to inclusion where possible.
- We need to further develop our recruitment, promotion, and personal development processes.
- We need regular, open, honest, and relevant information shared about equality, diversity and inclusion issues and actions across the National Centre for Atmospheric Science.
The data is being used to inform the NCAS Equality Diversity and Inclusion Living Action Plan, which is being developed in Autumn 2022 with staff focus groups and will provide steer for the next five years.
Have a question, suggestion, or concern? Please contact Lisa Banton, Head of People, EDI & Workforce Development.