New online tool tracks progress and challenges in curbing air pollution
Making the invisible visible, scientists have created an online tool for anyone to plot air pollution anywhere in the world.
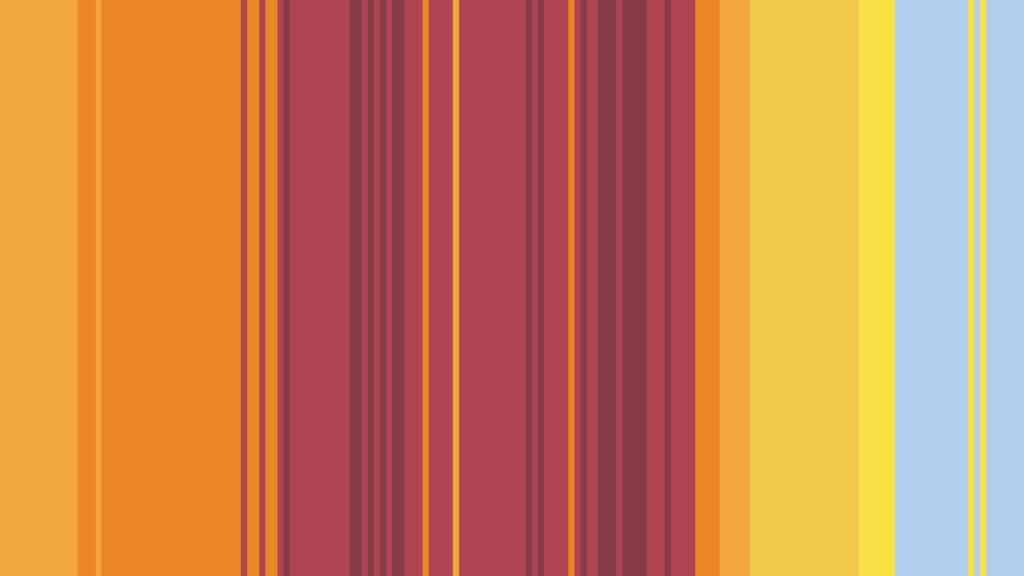
Inspired by the famous climate stripes, created by NCAS climate scientist Ed Hawkins, the new Air Quality Stripes show the significant improvements in air quality across much of Europe, and the alarming deterioration in parts of Africa and Central Asia.
The blue, yellow, orange, red, brown and black stripes illustrate the changing trends in outdoor concentrations of what is known as particulate matter air pollution over recent decades.
Particulate matter air pollution is a mix of tiny liquid or solid particles such as dust, dirt, soot, or smoke, which are found throughout the atmosphere and known to affect human health.
There are Air Quality Stripes for the capital city of every nation worldwide, plus a few extras for China, India, the UK and USA.
The graphics highlight both the successes and ongoing challenges in tackling air pollution worldwide, and aim to tell a straightforward story of complex environmental datasets.
The colour palette for the Air Quality Stripes was devised by an artist who analysed over 200 online images of “air pollution” to identify the dominant colours.
The lightest blue stripes show particulate matter concentrations that meet the World Health Organisation Air Quality Guidelines, which were introduced in 2021, with all other colours exceeding the guideline values.
What do the Air Quality Stripes show?
- Stricter air quality regulations and technological advancements have successfully reduced particulate matter concentrations in most European cities e.g. London, Brussels, Berlin.
- Rapid urbanisation, industrial growth, and limited regulatory frameworks are contributing to a concerning rise in particulate matter air pollution in central Asia and Africa e.g. Islamabad, Delhi, Nairobi.
- There are stark disparities in air quality progress between different regions, emphasising the need for targeted international efforts to address air pollution in the most affected areas.
- Natural sources, such as desert dust and wildfires, were particularly obvious in some locations – and locations closer to the coast had lower levels than expected e.g. Jakarta.
The Air Quality Stripes follow in the footsteps of the Climate Stripes, which were created by Professor Ed Hawkins at the National Centre for Atmospheric Science and University of Reading in 2018. The Climate Stripes have since become very widely used as a visual representation of the Earth’s warming climate, and have also inspired the Biodiversity Stripes and Ocean Acidification Stripes.
The Air Quality Stripes were made by our research colleagues at the University of Leeds and University of Edinburgh – we encourage our staff and wider atmospheric science community to use and share them to support conversations about air pollution.
