Ed Hawkins’ climate stripes add colour to communication
Communicating about climate change can be challenging, but Professor Ed Hawkins has shown that simple data visualisations can capture people’s attention and leave a lasting impression.
Earlier this year, Hawkins created a colourful climate change timeline that looked more like a piece of modern art than a traditional data plot. Yet, the message resonated clearly with viewers.
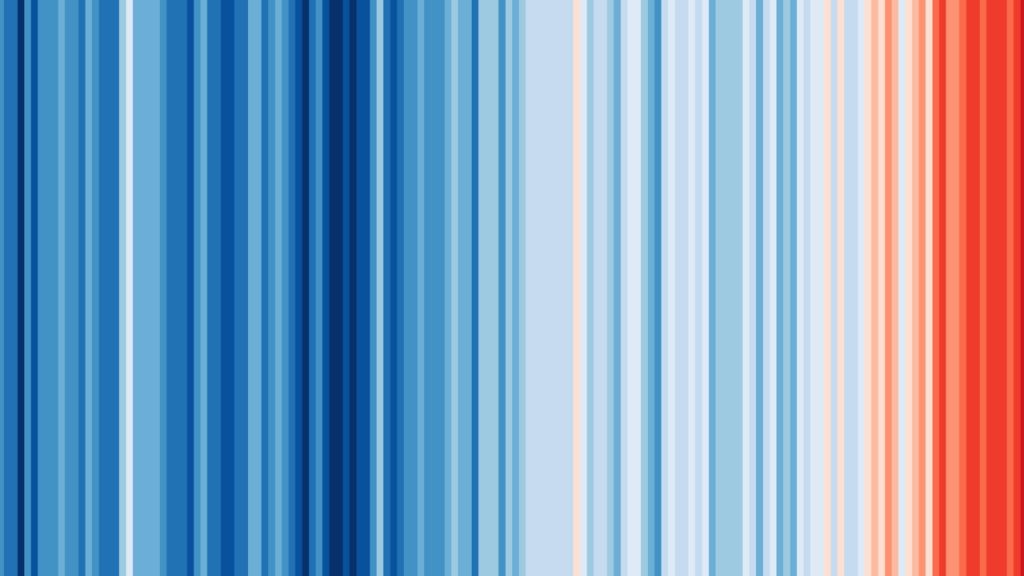
Hawkins, a climate scientist for the National Centre for Atmospheric Science, used historical data to create something new. His set of climate stripes illustrate the long-term rise in average temperature in different parts of the world. Historical data sets aren’t often a conversation-starter, but when Hawkins first shared his climate stripes graphic on Twitter it received nearly four-thousand shares from other tweeters.
Each stripe represents the temperature of a single year, and together they paint a picture of our changing climate in a compelling way. Hawkins swapped out numerical data points for colours which we intuitively react to. The soft blues and warm reds produce a simple yet effective image and remove the distractions of a normal scientific graph.
I wanted the long-term trends and variations in temperature to be crystal clear for viewers. Our visual system will interpret the stripes without us even thinking about it.
Professor Ed Hawkins, University of Reading
The climate stripes image accompanying this article shows the annual temperatures in central England from 1772 to 2017. More graphics for a variety of UK locations, including Durham, Oxford and Sheffield are available on Ed’s Climate Lab Book blog.
Hawkins is based at the University of Reading but has produced sets of climate stripes for locations all around the world, including USA, Canada and Germany. These images have made an impact across the globe, even showing up at a golf club meeting in New Zealand!
The climate timelines start from the earliest available records, typically during the nineteenth century, and continue to present day. Using local datasets has allowed more people to connect with the climate stripes, and also highlights the same patterns appearing in different climates worldwide.
Hawkins’ concept gathered widespread support from across the community. As more and more people recognised the effectiveness of Ed’s climate stripes, the colourful graphic became more than just a digital image. Enthusiasts capitalised on the potential to reach larger audiences by adorning clothes, mugs, coasters and even a Tesla EV with the colourful design.
On the summer solstice nearly 100 meteorologists wore ties or necklaces displaying the climate stripes on live tv. This campaign was coordinated by #MetsUnite, and asked presenters to explain the significance of their colourful accessories to viewers in an effort to promote awareness of climate change.
This isn’t the first time that Hawkins has captured the public’s attention by displaying observation data in unique ways. In 2016, his climate spirals animation quickly went viral online, and was even displayed in the opening ceremony of the Olympic Games in Rio. Sometimes the best way to communicate old information is to find new ways of presenting it.
